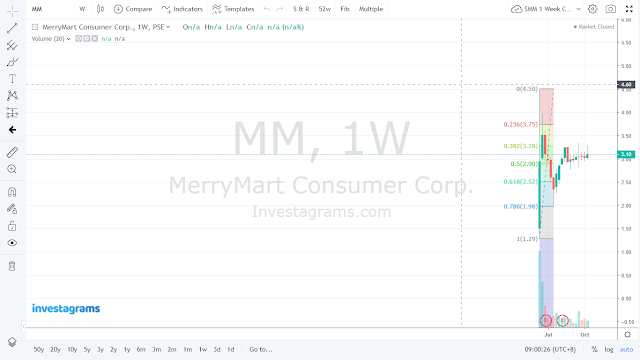
I entered @ 3.01 for the stock looks like VCP to me. After few minutes, when I returned to my table, the stock made a new high @ 3.30. It is still too early. It is just 10:40 in the morning. This stock has been in consolidation for 44 days. So that's a good sign. There is no excessive emotion involved yet. And both the volume and the value too are good. Volume is 31.44 million higher than yesterday's trade. Value now is 183 million. Wait for late comers to ride this run. When you see them coming, that's the time to move out.
Charts are interesting. Both the weekly and the hourly charts show that this stock stopped its pullback respecting the 78.6% fibonacci retracement:


16 comments:
My stock for today. My question yesterday has been answered today. After a 44 day consolidation, the stock is now waking up. Candlestick is inverted hammer. That's bullish! Let us see if such price action will be sustained this week.Volume is 76.07 million higher than yesterday. 14.61 million net foreign. Let us see if 3.35 will be broken.
After period of consolidation for more or less two months, the stock broke 3.35, the 24 September resistance and closed @ 3.40 with 6.58% gain. Traded value is 69.46 million higher than yesterday's. Many are now anticipating higher prices in the coming days. Some would forecast 4.00, 4.50, 5.00, 8.00, 9.00, 10.00 and even 12.00. Some would even claim that they are in this stock for a longer period of time. Three trading days ago, you will never read such optimistic forecasts. Nevertheless, a few are still skeptical about the stock's price action maybe because they were not able to ride its upward move. Previous experiences are referenced for the stock's possible movement by tomorrow. Some think that since tomorrow is the last trading day for this week, profit taking will cause this stock to pull back. Others are waiting for such pull back considering it an opportunity to enter the trade.
If the top is 3.70, pick the stock at its 61.8% or 78.6% Fibonacci retracement: 3.27 or 3.15
I changed my mind about this stock. As I analyzed the stock using EWT, I observed that the stock is still in its early of forming Wave 3 of Wave 3. This kind of wave is supposed to be the strongest. Let us wait and see. 4.85 will be my new exit point.
Another lower low and lower high tomorrow will cause short-term traders to exit this stock.
No sign of distribution yet.
Many shot-term traders are now exiting. A sign of distribution? New entry points: 3.20 or 3.11, 61.8% or 78.6% Fibonacci?
$MM - Among the most active, but unfortunately lost 6.80% today. I entered this stock @ 3.01 last 12 October. Today, when I saw the stock breaking yesterday's low @ 3.31, I decided to exit @ 3.27. However, looking @ the stock from a weekly time frame and from EWT, though the chart says that a 3rd wave is possibly forming, but the stock broke down its uptrend channel support. Short-term traders saw this and that's why they rushed to the exit door. Volume is 49.15 Million higher and net foreign is negative 6.14 million. Better to protect your gain and if you are thinking of re-entering this, consider @ 78.6% Fibo @ 3.11 or wait for the bears to calm down.
$MM - The stock has a lower low and lower high today and still outside the uptrend trading channel. Volume is 50.26 million lower and net foreign is 1.03 million. The stock did not touch 3.11, its 78.6% Fibonacci retracement and respected instead the 20 day moving average @ 3.12. Wait until Friday to see two more price bars to identify where this stock is heading.
With higher low and higher high today but volume is 10.85 million lower. Is this a typical "sell on rally" stock? One more price bar tomorrow and the stock direction will become clearer.
Today's price bar is clearer than yesterday. This is the second day that the stock made both a higher low and a higher high and the difference from previous trade is that its volume today is 9 million higher.
Higher low and higher high for the 3rd time. Volume is 5.31 million higher. Is breaking that 3.52 resistance the stock's next goal?
The stock almost acts like DITO making both lower low and higher high but closed strong with a volume 4.93 million higher than previous trade. Still, the stock's immediate target is to break that 3.52 resistance.
3.52 was broken and the stock made a higher high @ 3.55, but closed 0.1 below its resistance. Volume is 1 million higher, which is still a good sign, but traders' sentiment is not good for many are too optimistic about the stock. And besides though the % is small, the stock has been climbing for 6 consecutive trades. Time to get out?
The stock made a lower low and lower high today. For contrarians who do not like the popularity of optimistic outlook about this stock, perhaps for them, the stock's failure to sustain yesterday its attempt to break the 3.52 resistance is a sufficient signal to exit this stock. But for those who are bullish about this stocks, its 3.13% decline is just a temporary rest after gradually climbing up for six consecutive trades.
VCP pattern was confirmed when the stock took off from 3.01 last 13 October. I also notice recently that the stock has been consolidating inside the Darvas Box for 30 days. A higher level of Darvas Box is now in formation with the price range between 3.12 to 3.50. 3.12 is now the new support. The stock is on its 8th day. Wait for 4 weeks more. That's approximately by end of November.
Post a Comment