After computing the length of $CAL's 5 waves, I came up with a tentative conclusion that a potential trend reversal could take place 35 trading days from now. That would be around last week of July. If the length of Wave 5 will be 1.87X less than Wave 3, then a potential entry is between 1.70 to 1.73. However, if the length of Wave 5 is almost the same size or a little shorter than Wave 3, then $CAL could drop as low as 1.30. That's just my hunch. I will be a buyer between 1.70 to 1.73, but I will closely watch first internal indicators that selling is losing fire power before taking any position. 1.30 is my worst case scenario.
Tuesday, June 6, 2017
Thursday, May 25, 2017
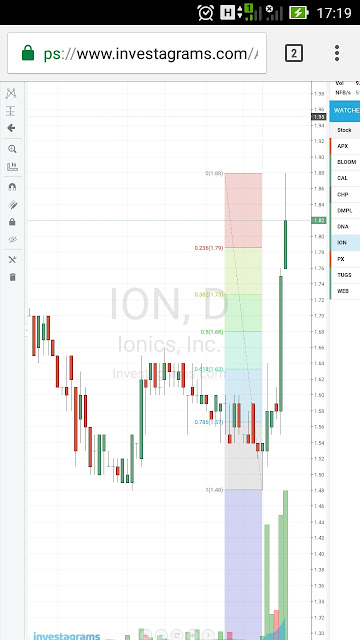
Re-entering $ION
Though my chart tells me that $ION has just finished its corrective wave 2, still I don't want to be too confident with my analysis, and that's why I decided to exit today @ 1.80. I have to prepare for my lecture this school year so I could not monitor my trade today. Better to lock in my profit before it turns to stone. Anyway, I can re-enter anytime and my ideal price is @ 1.63, 61.8 fibo retracement from 1.48 to 1.88.

Friday, May 19, 2017
An Update on $ION
Every trader knows that a "hammer" in a downtrend is bullish. We see this today in the case of $ION, ending with a long green candle, but with a longer upper shadow. This shows that bulls gained the upper-hand during the early phase in the tug-of-war between buyers and sellers, but lost control by the end of the day and the bears reappeared devouring their victims. An encouragement though that the price ends just with a miniscule 0.01 point above the average @ 1.58. Even this increase is unreliable for two traders managed to buy 4ksh @ 1.58 during the run-off. My initial impression with this kind of trade is one of a sucker rally, a DCB, a bull trap.

However, after examining some numbers, I had a little bit change of heart. We have both a higher low/high today. The volume is up 1,036% compared to the previous day. The management has been consistent with its buy-back program.
Examining the Income Statement and the cash flow of the company, I stumbled with some interesting data. Though the 1Q17 net income is flattish, just an increase of 6.35%, but I find the eps growth rate qoq quite impressive. This is in view of the fact that the revenue is down compared to previous quarter. If you convert into Php both the 1Q16 and 1Q17 epses, you will arrive @ 0.025 and 0.030 respectively. Though such eps growth rate will not pass the criteria of some traders to consider this stock, as for me, a 20% growth rate qoq is worthy of attention.
As for cash flow generated from operation, it is up 63.10% compared to 1Q16. Cash used in investment is higher 719.67% due to "property acquisition" as explained in Note # 10. Cash used in finance too is higher 83.26% due to '"lease payment" and "buy-back" program.
Finally, looking @ the stock from a monthly time frame, I see $ION has already completed its Wave 2 correction after 18 months. I smell a strong wave coming!

Tuesday, May 9, 2017
$CAL: Two Entry Prices
Wave 1 - 4.28 to 2.25 = 2.03
Wave 2 - 2.25 to 2.94 = 0.69
Wave 3 - 2.94 to 1.87 = 1.07
Wave 4 - flat (1.87 to 2.10?) = 0.23
Wave 5 - 2.10 - (< 1.07) = > 1.03
Entry Prices:
End of Wave 3/Start of Wave 4 = 1.87
End of Wave 5/ Start of Wave A = 1.10 to 1.50
Wave 2 - 2.25 to 2.94 = 0.69
Wave 3 - 2.94 to 1.87 = 1.07
Wave 4 - flat (1.87 to 2.10?) = 0.23
Wave 5 - 2.10 - (< 1.07) = > 1.03
Entry Prices:
End of Wave 3/Start of Wave 4 = 1.87
End of Wave 5/ Start of Wave A = 1.10 to 1.50
Friday, April 21, 2017
Trading Notes 22 April 2017
Wait for the trend to change before trading $APX, $CAL, and $DNA . . .
It is not their time yet . . .
Look for other stocks to trade . . .
Check $PX $COL and $CHP . . .
I think their trend has just recently reversed. . .
Both $PX and $COL are now resuming their uptrend. . .
$CHP's rally last 5 and 6 April has just been confirmed on 17 April . . .
$CHP's trend has now reversed . . .
$XAUUSD
Simply amazed!
As I observe how my experiment with EWP unfolds the accuracy of wave counts before my eyes. . .
Am I dreaming?
Is it a product of a biased mind?
Or is it purely mathematics?
Or as one Elliott analyst would ask, "Is this really the reflection of psychological DNA of those who trade $XAUUSD?

Now, $XAUUSD is heading towards Wave 3 of 3rd degree. . .
1st degree of waves are coded in blue . . .
2nd degree is in red . . .
The 3rd degree is in gold. . .
If this analysis is correct, $XAUUSD is now forming Waves 3 - 4 - B
The low of Wave 4 - C might revisit the 1260 + area but not to the point of touching 1261 again. . .
That's the best time to take position in $XAUUSD . . .
That's a big wow!!!
$PX
Both Waves 1 and 2 of a higher degree are done . . .
The stock is now forming Wave 3 . . .
Waves 1 and 2 of a lower degree within Wave 3 are already completed. . .
$PX next destination is Wave 3 - 3 . . .

The stock is now forming Wave 3 . . .
Waves 1 and 2 of a lower degree within Wave 3 are already completed. . .
$PX next destination is Wave 3 - 3 . . .

$CAL
Don't be in a hurry. . .
The stock is still in a downtrend. . .
Avoid speculating about the company's past as the cause of its decline . . .
Or any price manipulation on the part of insiders. . .
Don't argue with the tape. . .
It doesn't help. . .
It makes you a loser. . .
Simply study the chart carefully. . .
And follow its lead . . .


$COL
9 months of consolidation. . . I think around 174 days. . . The normal is 40 days. . .
Is $COL ready to soar to 18.00 + ?

Is $COL ready to soar to 18.00 + ?


$STI

$STI caught my attention from Finance Manila. Just posting it here for future reference. In case I will have position in this stock, I will consider its fib retracement as my entry point:
50% - 0.90
61.8% - 0.82
Wednesday, April 12, 2017

Monday, April 10, 2017
Trading Notes 2 : $WLCON $CHP $APX $CAL $DNA $PX
1. $WLCON
The chart is still neutral though Deutsche and CLSA showed strength today for $WLCON to finish @ 5.23.
2. $CHP
Still have 3 more trading days to confirm whether the 5-6 April rally is for real. The volume doesn't look good and so are the lower low and lower high.
3. $APX
I consider it a good indicator to see First Metro as the only strong buyer today. It was a seller last 7 April @ 1.50 but a buyer now @ 1.54.
ABCap is still selling @ 1.53 but with a lower volume from a net amount of 1.3M down to 805k.
As a seller, COL is an unreliable indicator. Quality is a solid buyer @ 1.54 with 154k net amount.
Generally, the stock is still in the woods, rising but with lower volume. If volume will increase the next trading day, knowing the behavior of the stock, it is better to sell it the following day.
4. $CAL
Likewise, COL as a buyer is a weak indicator. Strategic is a stronger seller today than last 7 April. Not a good sign.
5. $DNA
BPI sold strong @ 6.49 with 1M net amount. Also not a good sign. Dragonfly doji is bullish but lower low/high is bearish.
6. $PX
BaSec is the only good indicator. Higher low/high but low volume. Candlestick is hanging man. Ideally, the price of gold tonight will dictate the price of gold stocks tomorrow, but for the past few weeks, this has not been true in the case of gold stocks @ PSE.
Sunday, April 9, 2017
Trading Notes : $CHP $APX $CAL $DNA
1. $CHP
Holders capitulated and this is particularly obvious in COL's case, which has been a buyer from 13 Feb to 10 March @ a price range between 8.42 to 9.60. However, beginning 13 March, up to 7 April, COL became a seller @ a price range between 7.21 to 7.81.
The graph I made shows that for the last 3 weeks the trend has been buying high and selling low. This is a sign of capitulation. Interestingly, the trend this last week seems to turn upward. I still 4 more trading days to confirm if this shift is real. That will be on 17 April.
2. $APX
UNICAP is already in the buy side. Only ABCAP and SB EQ remain the strong sellers. ABCAP is weakening while SB EQ is selling down the stock. See SB EQ's trading record:
29 March - 8.2Msh @ 1.46
31 March - 1.4Msh @ 1.45
6 April - 4.2Msh @ 1.41
7 April - 1.9Msh @ 1.47
3. $CAL
a. Still in a downtrend. Capitulation is evident. Typical example is First Metro, a buyer between 2.09 to 2.36 but became a seller @ 2.06.
b. COL's buying enthusiasm too is diminishing. Once COL turned seller, I see it as a good sign of capitulation and an approaching trend reversal.
c. 3 to 7 April - The 4 biggest sellers were missing in action: Strategic, Unicap, Coyiuto, and IGC.
d. Signals to wait: end of Wave 3, volume dry up and price tightening, COL on the selling side, the 4 sellers on the buy side, and bigger volume but price stops to drop.
e. Solid Buyers: Triton @ 2.38, Aurora @ 2.47, BDO @ 2.49, Alpha @ 2.30, Ansaldo @ 2.39, Jaka @ 2.20, and E Chua @ 2.12
f. Solid Sellers: Strategic between 2.22 to 2.41 and IGC between 2.26 to 2.35
4. $DNA
a. There was a capitulation between 27 Feb to 3 March.
b. The whole of March is insignificant due to low volume.
c. First week of April shows new players, BPI and UniCap, with higher volume but lower price. The strength of both buyers and sellers appears even.
d. I still have to wait for the disclosure of FOO price.
Friday, January 20, 2017
$ALT 4
Wave 1 - 34.00 to 18.00 = 16.00
Wave 2 - 18.00 to 31.00 = 13.00
Wave 3 - 31.00 to 12.00 = 19.00
Wave 4 - 12.00 to 14.00 = 2.00
Wave 5 - 14.00 to 6.00 = 8.00

Interesting Price References:
12 August 2016 - Mr. Navasero bought 208M shares at 1.74 x 5 = 8.90
16 November 2016 - Someone bought from Mr. Navasero 50M shares @ 2.88 x 5 = 14.40
Both Sarangani and Papa Sec have been selling $ALT @ 9.20.
FOO Indicative Offer Price Range: Between 3.25 to 6.75
The "Masters' Recommendation: Go all in @ 3.30
Game Plan: Trade between 6.00 to 9.20, 9.20 to 12.00 and 12.00 to 14.00.
$PX 3

Wave 1 - 3.75 to 6.34 = 2.59
Wave 2 - 6.34 to 5.14 = 1.20
Wave 3 - 5.14 to 9.50 = 4.36
Wave 4 - 9.50 to 8.75 = 0.75
Wave 5 - 8.75 to 11.00 = 2.95
Add more shares @ 8.75 and sell @ 11.00.
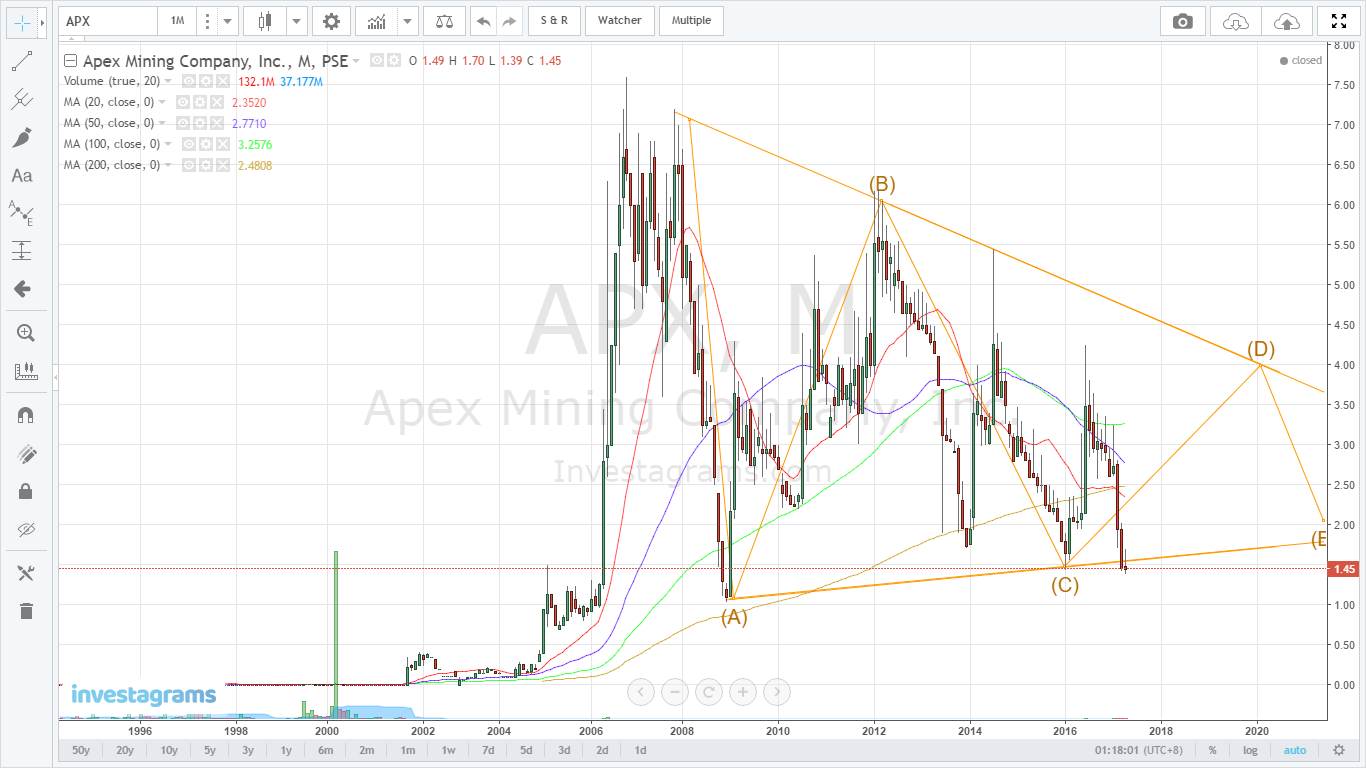
$APX 2

Wave A - 6.50 to 1.00 = 5.50
Wave B - 1.00 to 6.00 = 5.00
Wave C - 6.00 to 1.75 = 4.25
Wave D - 1.75 to 3.90 = 2.15
Wave E - 3.90 to 2.55 = 1.35
$APX is forming Wave D. 3.90 is the target price to exit.
After Wave D, 2.55 will be the final entry to complete the corrective triangle before a breakout to the upside.
Monday, January 16, 2017
Great Shocker this 2017
Just finished reading an article from Silver Doctors and here's its summary:
The global economy is suffering from both sovereign and business debt amounting to over $150T (Source:IMF). As for the US, including unfunded liabilities, their total debt is $100T. And yet with this huge debt, the dominant narrative is one of economic recovery. And to confirm this narrative, the Fed has just recently raised interest rates and promised to increase 3x more this 2017. Then we have President Trump and his administration with its massive infra spending, deregulation and lower taxes. Will these programs cause the US to solve its sovereign debt problem or will they plunge the US deeper into debt?
This middle of March, the US debt ceiling will be hit. Without a change in monetary policy, servicing this debt is indeed a big headache. In fact, higher interest rates will result to increasing defaults and bankruptcies worldwide. And so Deepcaster anticipates that before June, the Fed will back off from its hawkish statement and will shift to monetary easing. This monetary policy is more consistent to finance the agenda of the new administration. The trouble is, once this shift is made, there will be massive sell-off of USD and the onset of hyperinflation will take place. This will boost oil and gasoline prices. To prevent this outcome, the new administration has to find the way how to solve its sovereign solvency issue and how to deal with the impotence of the Fed. With this kind of economic scenario, I anticipate that excessive speculation and great market volatility will follow.
Source:
www.silverdoctors.com/gold/gold-news/surmount-impending-markets-shocker-to-profit-protect-deepcaster
Sunday, January 15, 2017
Hyping $CAL
"Susunod na to sa $TUGS sa 7.50..."
"Sa Monday maglalagablab na to..."
And you can read many other similar messages anticipating $CAL to soar as a result of a disclosure and a press release...
Others issued a warning:
"Marami talagang hindi natuto sa hudas na to!"
"Pag pumasok ka kay $CAL, huwag mong iiwan. Bantayan mo dahil baka pagbalik mo pula na port mo. Isang paalala mula sa ex-$CAL victim."
Despite its huge price decline for the past few months and due to a recent one-day rise, the dominant sentiment for this stock is bullish.
So it appears that all the stars are aligning for this stock...technical analysis, SWAG in particular; disclosure; and press release...
As for me, at first I do not doubt that the chart is bullish. In fact, I saw the stock already completed the bullish ending diagonal pattern. However, whenever I hear a stock getting so much attention, I get suspicious...
Nevertheless, only a chart can temper my suspicion. I revised my previous charts and this one somehow satisfies me except for the 5 sub-waves of Wave B.

At first, I want to make a chart that confirms my bias that the current rise of $CAL is a Wave A rally and I have to wait for the completion of Wave B before re-entering. To my surprise, as I carefully follow the rules and guidelines of Elliott Wave Principle, I realized that both Waves A and B were already finished and $CAL now is advancing its Wave C rally. In fact, Wave A was completed middle of September and October last year. And the low of Wave B has already been established at 2.25.
To appreciate the above chart, you need to see its longer time frame:

In the above chart, you can see $CAL completed the 3-3-3-3-3 ending diagonal pattern with a "throw-over" wave 5. After finishing the pattern, the corrective waves that follow are confusing particularly when it comes to Wave B for it has 5 sub-waves instead of 3. It is at this point that I changed my mind and turned bearish on this stock. As EWP reminds us that such kind of Wave B could be a resumption of Wave 1 of higher degree. And since $CAL is in a long-term downtrend, this could mean a continuation of downtrend. If this is the case, the rally that is now going on is actually Wave 2, an upward correction, which I anticipate will have 3 sub-waves. Having said this does not mean that I will close my mind to the possibility that $CAL's current rally is really a legitimate bullish one. I still need to wait for the waves to unfold until the time I can clearly recognize its primary trend. And then that's the time for me to take a position in this stock. For now, I just want to congratulate those who bought at 2.25 and are now enjoying their gains.
Friday, January 13, 2017
$PSEi 10,000
$PSEi 10,000. The first time I heard this from master traders, I was really so skeptical. Didn't they predict in April 2015 that PSEi will reach 10,000? What happened after that prediction? Didn't PSEi lose 2,100 points after 9 months in January 2016? And again, didn't the masters repeat such message in July 2016? What happened after that? PSEi lost 1,600 points after 6 months in December last year.
Why am I now repeating such "mantra"?
My study of Austrian economics made me see the shaky foundation of the monetary system of the world, which is the root cause of the deepening deterioration of global economy. This is a belief I think that all Austrian economists share. They got such insight from the Austrian Business Cycle theory. As a result of such influence, I was a convinced bear. Such trading stance made me cautious in the way I buy and sell securities in the stock market.
However, stumbling with Elliott Wave Principle made me change my mind. After studying the first six lessons of Elliott Wave Principle I became a convinced bull as I relate EWP insights to the current market status of PSE. This does not mean that I ignore the fundamental economic reality provided by the Austrian school. This does mean however, that as far as technical analysis of PSEi is concern, and in this particular case of Elliott Wave Principle, PSEI still has one more cycle wave to finish before the dreaded correction will take place.
This chart shows that Wave C correction was finished last December...

To understand the context of the above chart, we need to look at it in its longer historical time frame. This chart covers the period from 1986 up to the present...

And then I made a parallel channel connecting 3 reference points by making a line to connect the peak of Waves 1 and 3 and drew a parallel line touching the low of Wave 2.

That's where I got this idea of PSEi 10,000...
Tuesday, January 10, 2017

Saturday, January 7, 2017
$DMPL
Danger! Danger!
I see danger approaching...
But one technical analyst sees an opportunity...
I don't deny the opportunity...
But in my reading, it happens after my foreseen danger takes place...
Anyway, both of us use technical tools...
And for him $DMPL is bullish...

And here is another technical analyst who thinks that $DMPL's trend has now turned bullish...

Seeing recommendations like these might prompt a trader to have a position in this stock...
I like this stock...particularly its canned fruits...
Meanwhile, I met a young long-term investor in facebook who really likes this stock...
He even gave me an advice not to follow the footsteps of technical traders...
I think he doesn't know what he is talking about...
Anyway, if he is true to his long-term commitment, this approaching danger is a great opportunity for him to add more shares to his position...
But of course, he has to endure first the pain of seeing a huge paper loss...
But as for me, I will only deploy capital in this stock once the storm passed away...
I based my interpretation on this chart...

A few weeks to months from now, we will know who is right...
Thursday, January 5, 2017
$PSPC
$PSPC is a very unpopular stock since its IPO day...
It crashed from 3.40 down to 1.27 after less than a year of being traded in the PSE...
Looking at $PSPC's chart for the past few days, I find it difficult to interpret its price pattern...
After having an elementary knowledge about EWP, I just want to experiment if this chart would work...

Profit or loss will be my feedback whether I got it right or not...
By the way, $PSPC's chart has the following features:
- Extended 3rd wave...
- Truncated 5th wave...
- And today, it closed with a hammer, which is about to break that downtrend line...
Result of My Experiment
I was too excited with my experiment...
My entry was correct...
I was the first buyer...
I bid at 1.43...
My bid hit 1.42...
And then the price went up to 1.55...
I did not exit...
I believed that it was a trend reversal...
I was careless...
As I checked my chart and instead of a trendline, I drew a parallel channel...

I observed that the price bar has not yet broken out of the downtrend line...
And besides one requirement to qualify a truncated 5th wave is the existence of 5 subwaves...
My counting was wrong...
I was in a hurry to mark the low of Wave 5...
I think there will one final pullback to establish the 5th wave's low...
That's the time to re-enter...
For now, I must go out even with just a minimal gain...
Subscribe to:
Posts (Atom)